On Thursday on CNBC, there were several guests called "Squawk Masters"
who supposedly know what's going on. One of them was Ron Baron,
chairman and CEO of Baron Capital, who said that the stock market was
about to take off:
Ron Baron wrote:
> Because everyone's afraid to invest, stocks are at the lowest
> level, the most attractive level, in my lifetime.
> In the 1980s and 1990s, we were doubling every 4-5 years, and then
> during the last 10 years, the market was up 20 or 30 %, and we
> [were up] 130% something in that range [over ten years], at 7%
> [per year], instead of 14 or 15% per year. I think we're on the
> verge of returning to the opportunities we had in the 1980s and
> 1990s.
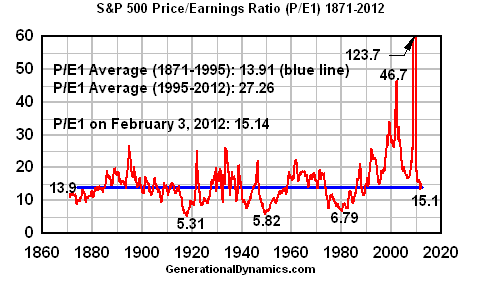
I've heard other "masters" talk about a return to the 1980s. How
stupid can these people be? In 1980, the S&P 500 P/E ratio was 6.79,
and had been well below average for 10 years. Today it's at 15.1, and
it's been WAY above average for 16 years. This is simple stuff. You
don't have to understand generational theory to realize that today's
stock market is in NO WAY comparable to the 1980s. These people are
morons.
No, I take that back. Ron Baron and others like him aren't morons.
They're crooks. In a column yesterday by Lee Adler commenting on how
surprised economists are at Thursday's unemployment claims numbers:
Lee Adler wrote:
> It seems to me that the big surprise is that any economists were
> surprised, but then, knowing how great the economics profession is
> at forecasting, I’m really not surprised. The vast majority of
> economists are either clueless bozos or paid shills, often both.
http://wallstreetexaminer.com/2012/02/0 ... have-been/
I like "clueless bozos or paid shills, often both." I'm going to use
that.
I've updated my graph on the P/E ratio back to 1871:

What's interesting about this graph is that P/E ratios (valuations)
are finally beginning to fall below average, and by the Law of
Mean Reversion, are poised to fall well below average, probably
to below 5.
The other thing that I think is really interesting is that the
intervals between lows are remaining fairly constant. The ratio
reached 5.31 in 1917, was 5.82 in 1949 (31 years later),
and 6.79 in 1980 (32 years later). So if there's a sharp fall
this year, then the interval would once again be 32 years. This
may indicate some kind of fundamental financial cycle that I don't
understand. At any rate, this should be of interest to the
chartists and the numerologists.
John
