Corporate income tax collections crashing again
One of the most bizarre stories have been that the Afghan/Iraq wars
and the Bush tax cuts were the cause of the federal budget deficit in
the last decade.
** Alan Greenspan blames the Republicans for the financial crisis
** http://www.generationaldynamics.com/cgi ... 16#e070916
Everyone seems to believe this, even though it couldn't possibly
be true, since the deficit began to increase in 2000, but the
wars didn't begin until 2002, and the tax cuts didn't begin until
2003.
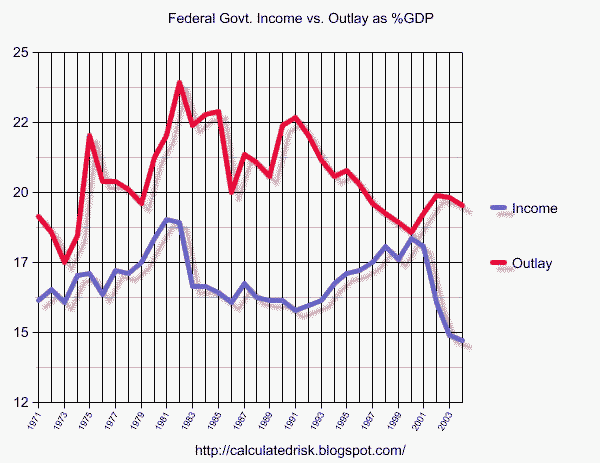
Here's a chart from Calculated Risk in 2005 that I've posted
several times:
 (Income vs Outlay as %-age of GDP for Federal Government,
1971-2005, not including Social Security
http://calculatedrisk.blogspot.com/2005 ... ficit.html)
This graph shows that the huge deficit, which was supposedly caused
by the Iraq war, actually began in 2000, the last year of the Clinton
administration, with the Nasdaq crash. The outlays caused by the
Iraq war were not particularly large by the standards of the
preceding three decades. What mattered was the collapse of tax
revenues, starting in 2000.
In fact, tax revenues depend on the state of the economy, and have
almost nothing to do with anything else. Tax revenues went up in
2006 because of the credit bubble, and in 2009 they crashed
dramatically.
** US tax revenues fall sharply, the most since 1932
** http://www.generationaldynamics.com/cgi ... 04#e090804
Now Higgenbotham has called my attention to a Seeking Alpha article
claiming that corporate income tax collections are falling sharply
again.
http://seekingalpha.com/article/260106- ... s-baked-in
In order to do some further analysis, I found the daily Treasury
statements for 12/31/2009, 3/31/2010, 12/31/2010 and 3/31/2011:
https://www.fms.treas.gov/fmsweb/viewDT ... 123101.txt
https://www.fms.treas.gov/fmsweb/viewDT ... 033101.txt
https://www.fms.treas.gov/fmsweb/viewDT ... 123100.txt
https://www.fms.treas.gov/fmsweb/viewDT ... 033100.txt
In each case, I took the data from "Table IV - Federal Tax Deposits" -
"Fiscal year to date" - to get the following table (all amounts in
millions of dollars):
Table IV - Federal Tax Deposits - fiscal year to date
Fiscal year 2010 Fiscal year 2011
------------------- --------------------
Classification Q1 Q1+Q2 Q1 Q1+Q2
------------------------------------- -------- ---------- ------- ------------
Withheld Income and Employment Taxes 407,327 852,175 440,065 899,957
Individual Income Taxes 1,305 4,232 1,708 5,734
Railroad Retirement Taxes 1,082 2,319 1,135 2,448
Excise Taxes 15,937 32,002 16,393 32,956
Corporation Income Taxes 57,167 109,509 60,017 96,079
Federal Unemployment Taxes 667 1,950 739 2,169
Estate and Gift Taxes & Misc IRS Rcpt 203 1,907 133 314
Change in Balance of Unclassified
Taxes 425 -42 62 -245
Total 484,114 1,004,051 520,252 1,039,412
These Receipts were deposited in:
Federal Reserve Account:
Directly 9,941 19,768 9,407 19,503
Collector Depositaries 120,143 256,217 149,240 286,580
Tax and Loan Accounts 335,513 690,958 341,487 694,362
Inter-agency Transfers 18,517 37,108 20,117 38,966
Subtracting adjacent columns gives us the comparisons of Q2 FY2010 and
Q2 FY2011, which is the first three months of the calendar years 2010
and 2011:
Classification 2QFY2010 2QFY2011
------------------------------------ -------- --------
Withheld Income and Employment Taxes 444,848 459,892
Corporation Income Taxes 52,342 36,062
Thus, payroll tax collections have increased $15 billion, while
corporate tax collections have fallen $16 billion. It's hard not to
notice the seeming equivalence of these two figures.
If crashing corporate tax collections mean that Q1 calendar year
corporate earnings are crashing, then this is highly significant.
It means that even the fantasy stock valuations promulgated by the
stock brokers are going to rise sharply. (Maybe I'm speaking too
soon. Expect to hear: "This is a one-time thing. Corporate earnings
will surge again next quarter, and P/E ratios based on surging fantasy
future corporate earnings are at historical lows, so you're crazy if
you don't throw all your cash into buying stocks.")
The other thing it means is that corporations are going to stop
hiring, once again. They will blame lower earnings on new hiring, and
that will be cut back pretty quickly.
Addendum: It just occurred to me that I think I've heard that most
new hiring was from small businesses, not corporations, so this may be
even worse news for corporations.
John
