I could see how 1600 on the S&P 500 could be justified with the 10 year US Treasury paying 1.6% - maybe. But I'm really not sure how 1800 on the S&P 500 can be justified with the 10 year US Treasury paying 2.9%.
Judging from the chart, Vince may be right about the 3.5%. Or maybe it will happen on a move over 3%. Another possibility is the economy isn't strong enough to take 3% and everything collapses as rates go back down for awhile. But in any case this might be an inflection point. I'm going to review McHugh's list of clusters to get an idea of how things went down in 2007/8.
Date of first Hindenburg Omen Signal 6/13/2007
# of Signals In Cluster 8
DJIA Subsequent % Decline 7.1%
Time Until Decline Bottomed 64 days
Date of first Hindenburg Omen Signal 10/16/2007
# of Signals In Cluster 9
DJIA Subsequent % Decline 16.3%
Time Until Decline Bottomed 99 days
Date of first Hindenburg Omen Signal 6/6/2008
# of Signals In Cluster 6
DJIA Subsequent % Decline 47.3%
Time Until Decline Bottomed 276 days
Also, this is from some information I got from McHugh earlier in the week: "Stocks fell on light volume Monday, December 2nd. We came close to seeing a new Hindenburg Observation Monday, but did not get one."
2007 Hindenburg Omens marked in red
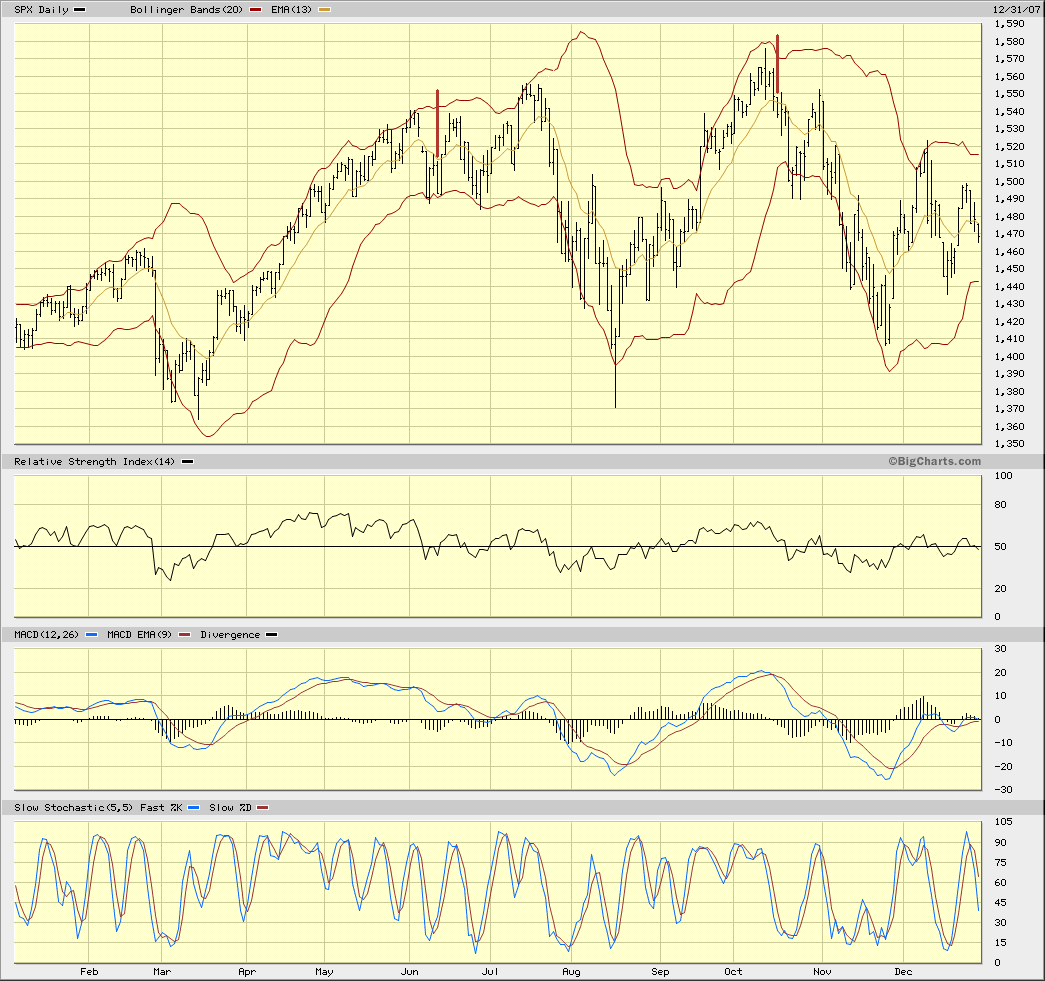
- 2007.gif (75.06 KiB) Viewed 4885 times
While the periphery breaks down rather slowly at first, the capital cities of the hegemon should collapse suddenly and violently.